65% of the Population Consists of Visual Learners – Guide Them With Data Visualization and Reporting

Using your business goals, target metrics, and other drivers defined in the marketing workshop, we create data visualizations, dashboards, reports and analysis tailored to the needs of the marketing team, executives or other stakeholders.
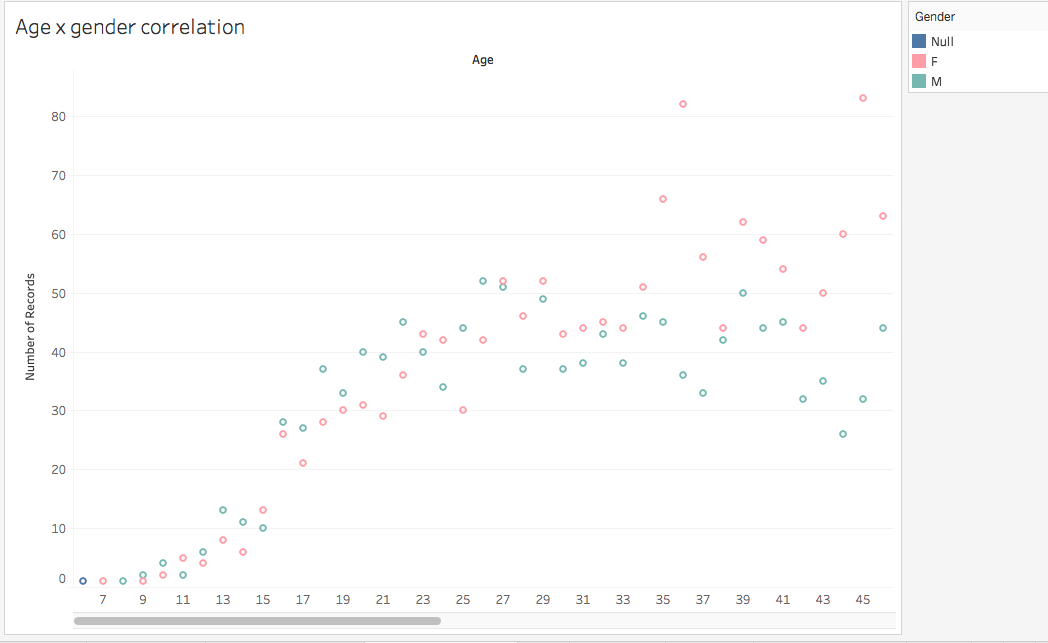
Rows and rows of static data become charts, graphs, and other easily consumable graphics to help you find valuable information – such as trends and patterns – hiding within the data. Business and operational decisions are made easier, faster and more confidently with this evidence.
Want to know more about your data? Reach out today and we can work with even a small data set to show you what's possible.